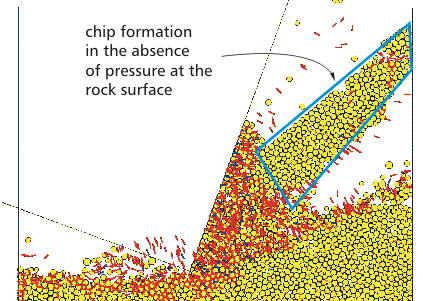
PFC2D is used to simulate rock cutting to learn more about drilling mechanics. The PFC2D models allow one to define a cutter (as a set of walls) and move this cutter at a specified velocity and depth of cut across a synthetic rock while monitoring forces on the cutter and damage in the rock. In a real borehole, the cutter uses drilling mud to produce a pressure that acts on the rock surface, and this pressure greatly increases the energy requirements of drilling — the pressure effectively strengthens the rock. A pressure-application algorithm has been developed that simulates the effect of the mud by continually identifying a connected chain of particles on the rock surface and applying a pressure to those particles as the cutting process proceeds. The pressure inhibits chip formation leading to a more plastic-like zone of damage that remains near to the cutter. (NOTE: The animations shown below derive from a full example that does not correspond to the default example provided in the PFC FISHtank.)

The PFC2D synthetic material, comprised of a densely packed particle assembly joined by parallel bonds, has been assigned microproperties to represent Berea sandstone. The macroscopic material properties are measured by performing a Brazilian test and two biaxial tests at confinements of 0.015 and 1.5 MPa upon 12 by 24 mm specimens. The following macroscopic properties were measured.
| |||||||||||||||||||||||
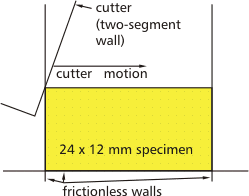
The specimen to be cut is 24 by 12 mm, and is confined by three frictionless walls on the bottom, left and right sides. The cutter is represented by a single wall of two segments that are perpendicular to one another with a back rake of 20 degrees. The cutter is moved horizontally across the rock at a velocity of 0.025 m/s (slow enough to approximate quasi-static loading conditions) and at a 4-mm depth of cut.

Two simulations were performed for which the pressure was set to zero and to 5 MPa. For each simulation, two sets of animations were produced. For the pressurized cases, the connected-chain of particles on the rock surface is shown. The two sets of animations depict: (1) specimen damage and (2) force distribution within the material.
The specimen-damage plots provide information about the intensity, location and orientation of the microcracks (and possible coalescence into macro-fractures) that have formed throughout the specimen. The crack distribution in the plots is depicted as colored line segments (for which red represents a contact that has broken in tension and blue represents a contact that has broken in shear) lying between the two contacting particles with a segment length equal to the average radius of the two contacting particles. The cracks are oriented such that the segment normal vector is parallel with the line joining the centers of the two contacting particles.
Specimen damage plots for the case of zero pressure (left) and pressure at 5 MPa (right)
The force-distribution plots consist of compressive forces (shown in blue) arising from particle-particle contact and compressive and tensile (shown in black and red, respectively) forces acting in the bonding material. The force magnitudes are scaled to the same maximum value, which equals 42 and 7 kN for the particle-particle contacts and the parallel bonds, respectively.
Specimen force-distribution plots for the case of zero pressure (left) and pressure at 5 MPa (right)
