Model Plot Contest Winners
As part of Itasca's 40th Anniversary celebrations, we invited our software users to submit in their model plots that best showcased the capability, flexibility, and beauty of Itasca software for one of four themes:
- Mining
- Civil
- Energy
- And now for something totally different
In receiving many impressive entries, we also added an Honorable Mentions category. The judging panel consisted of Dr. Peter Cundall, Prof. Charles Fairhurst, Dr. Lee Petersen, Ms. Helen Kalm, and Dr. Jim Hazzard. Winners for each theme received a prize of a one-year lease of their choice of Itasca software (3DEC, FLAC, FLAC3D, Griddle, PFC Suite, UDEC, or XSite) and Honorable Mentions received a prize of a two-month lease web license of their choice of Itasca software (3DEC, FLAC, FLAC3D, Griddle, or PFC Suite). Awardees will also receive a certificate of achievement.
Mining Engineering
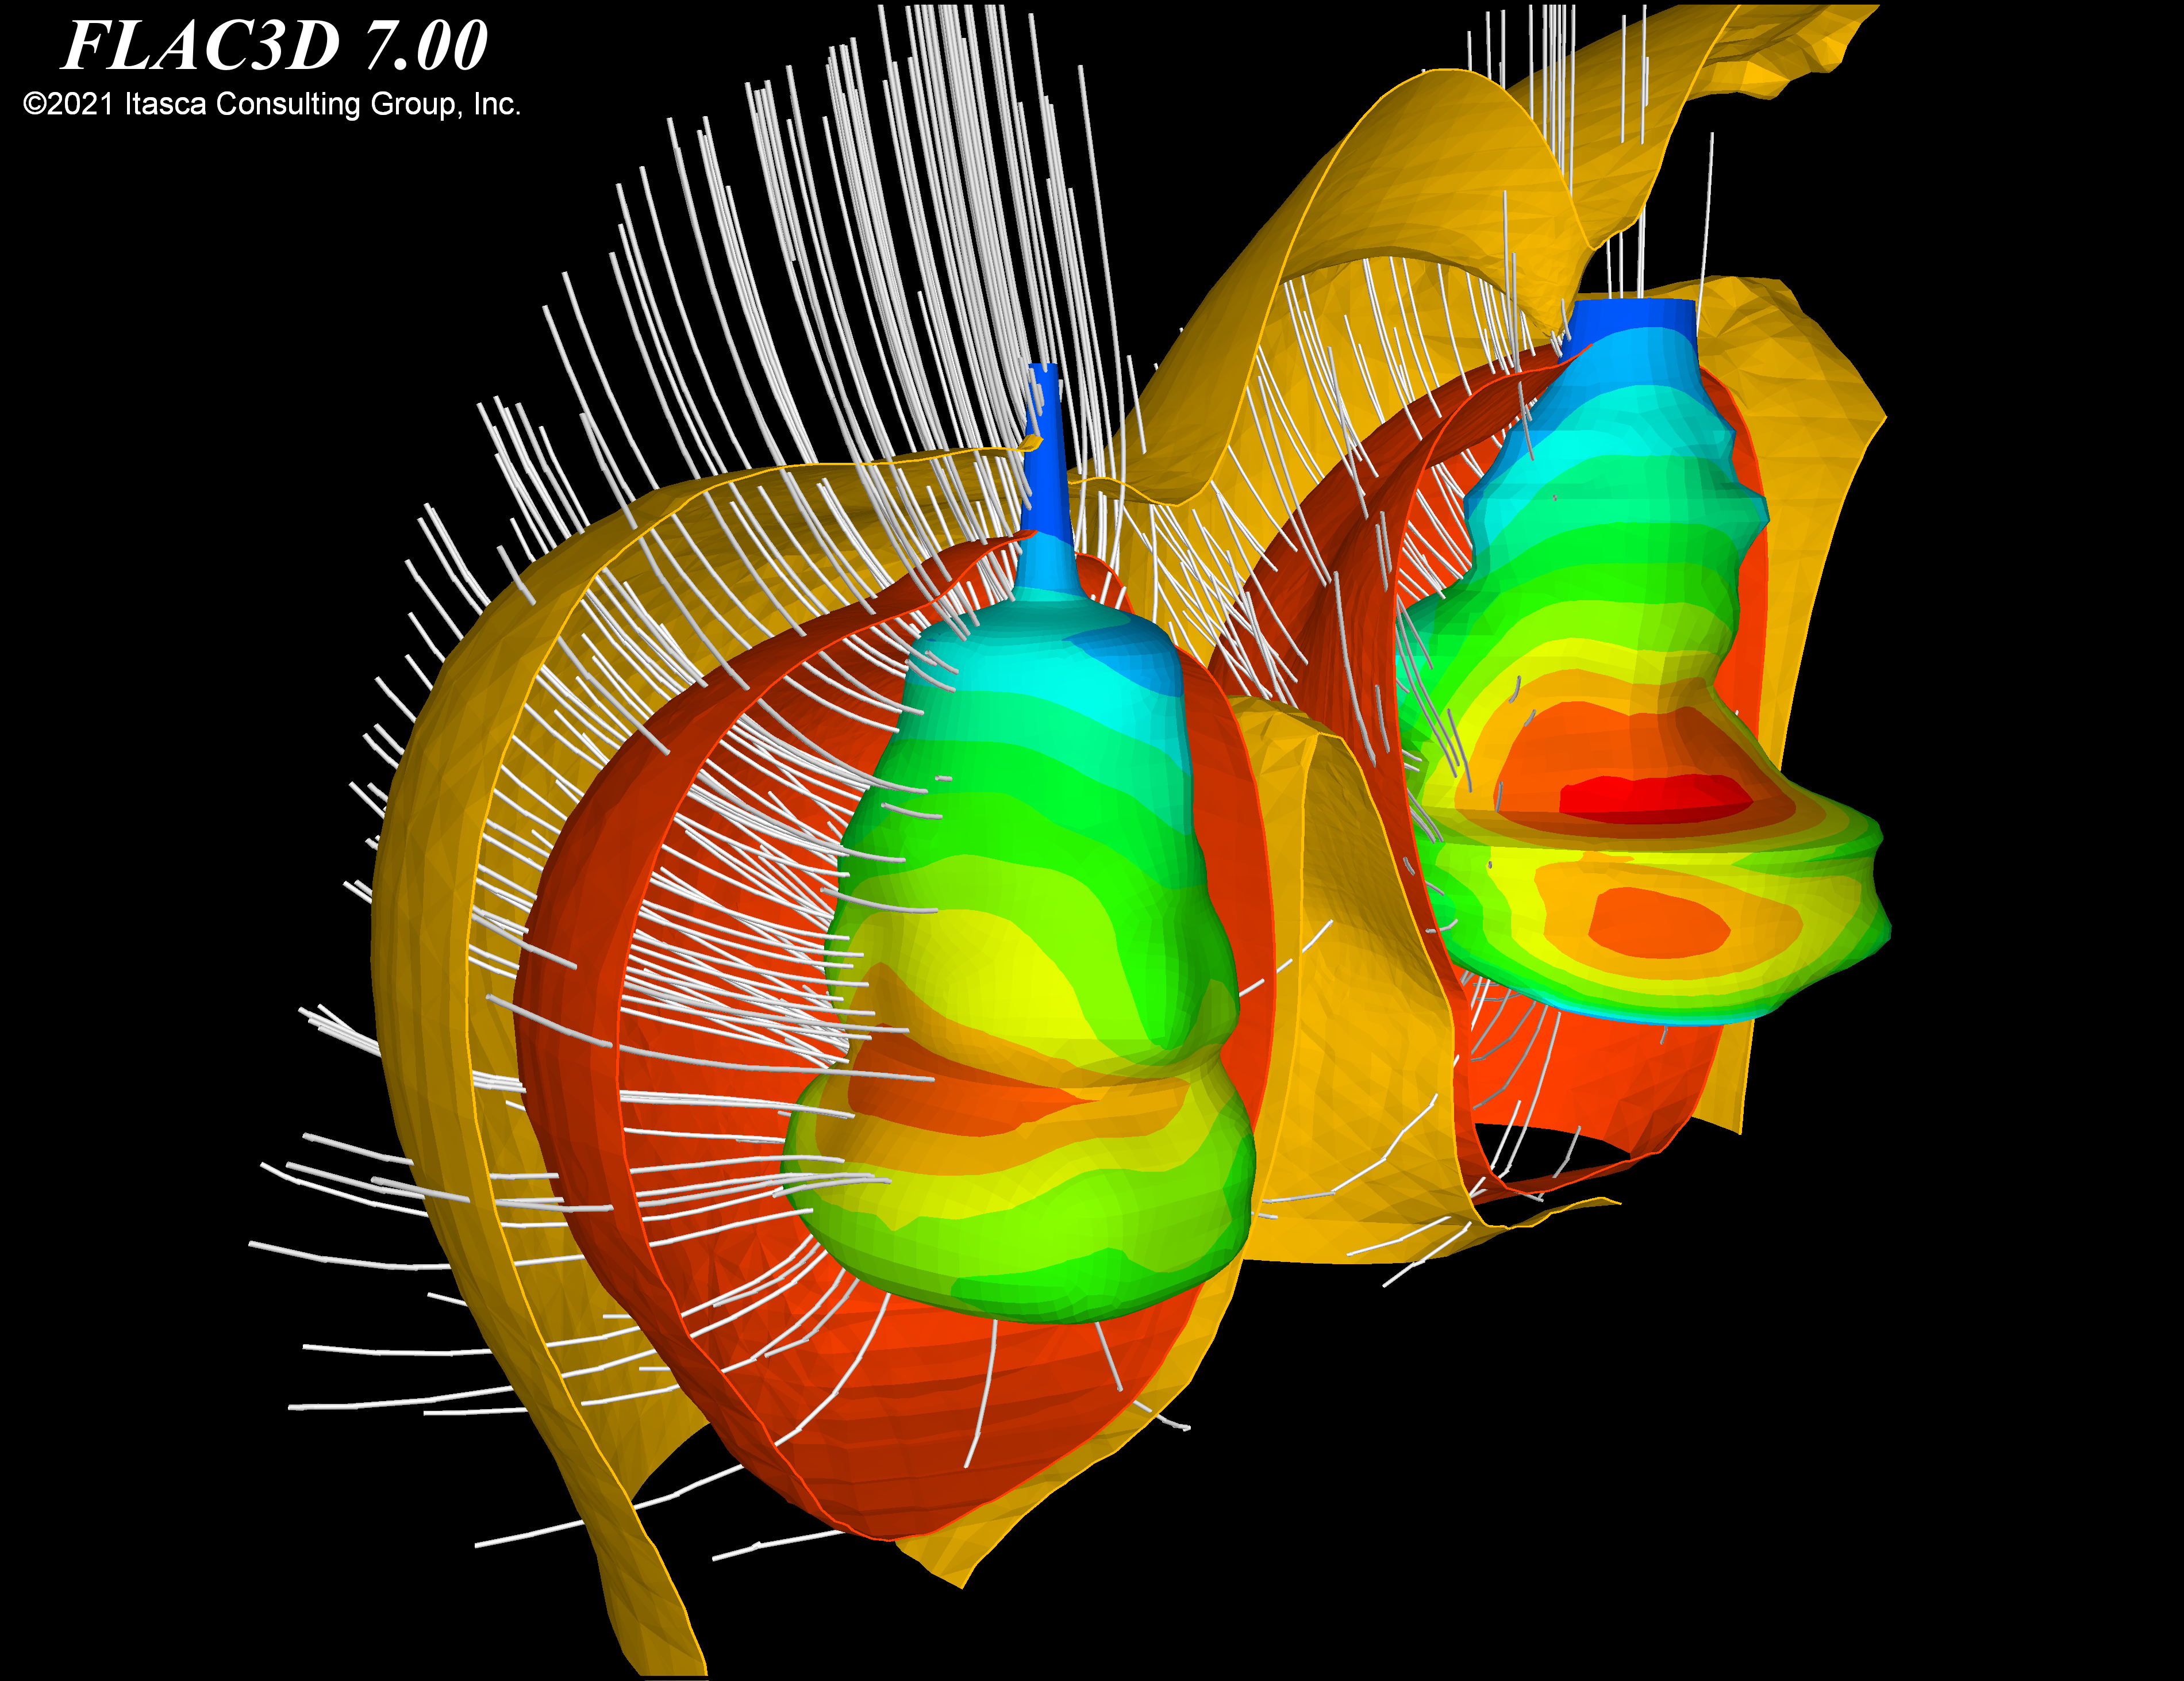
Markus Knauth | Institut für Gebirgsmechanik, Germany
Displacement field around two salt caverns visualized with contours, isosurfaces, and a custom-made streamline representation using the data vector functionality.
Civil Engineering
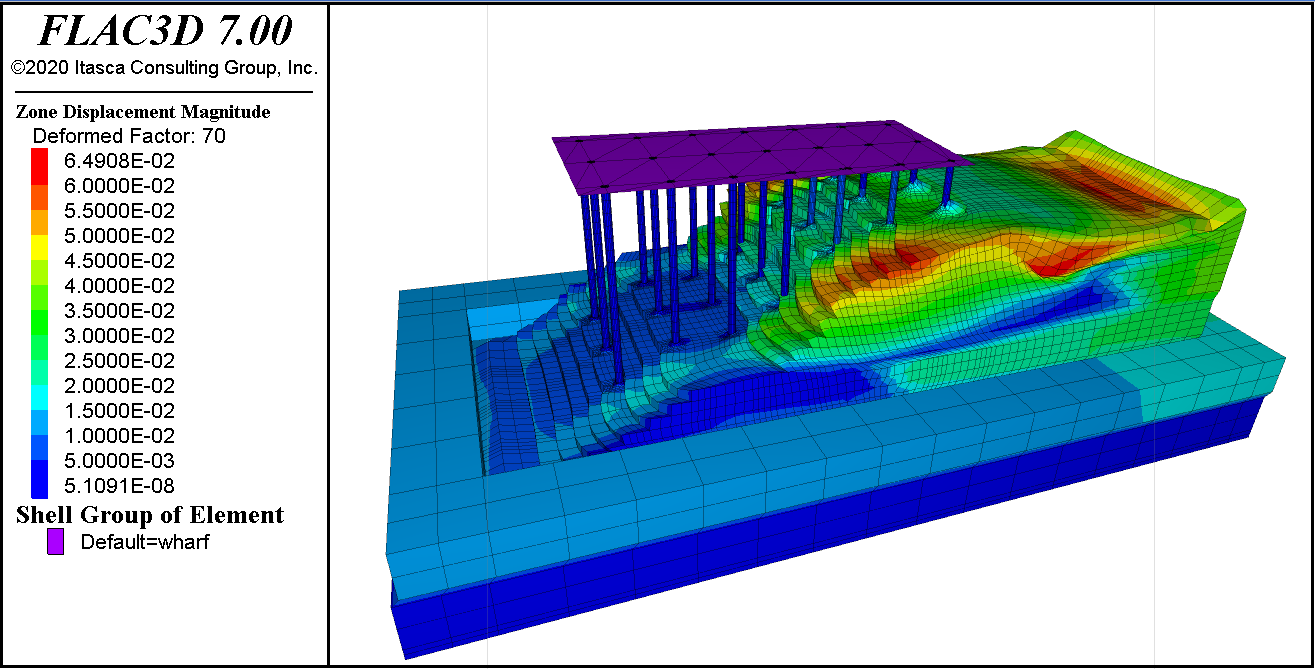
Milad Souri | Geotechnical resource Inc., United States of America
Magnified horizontal soil displacement showing the pile pinning effect. These figures are related to an NSF-funded project on a 3D modeling of a pile-supported wharf subjected to liquefaction-induced lateral spreading.
Energy Engineering
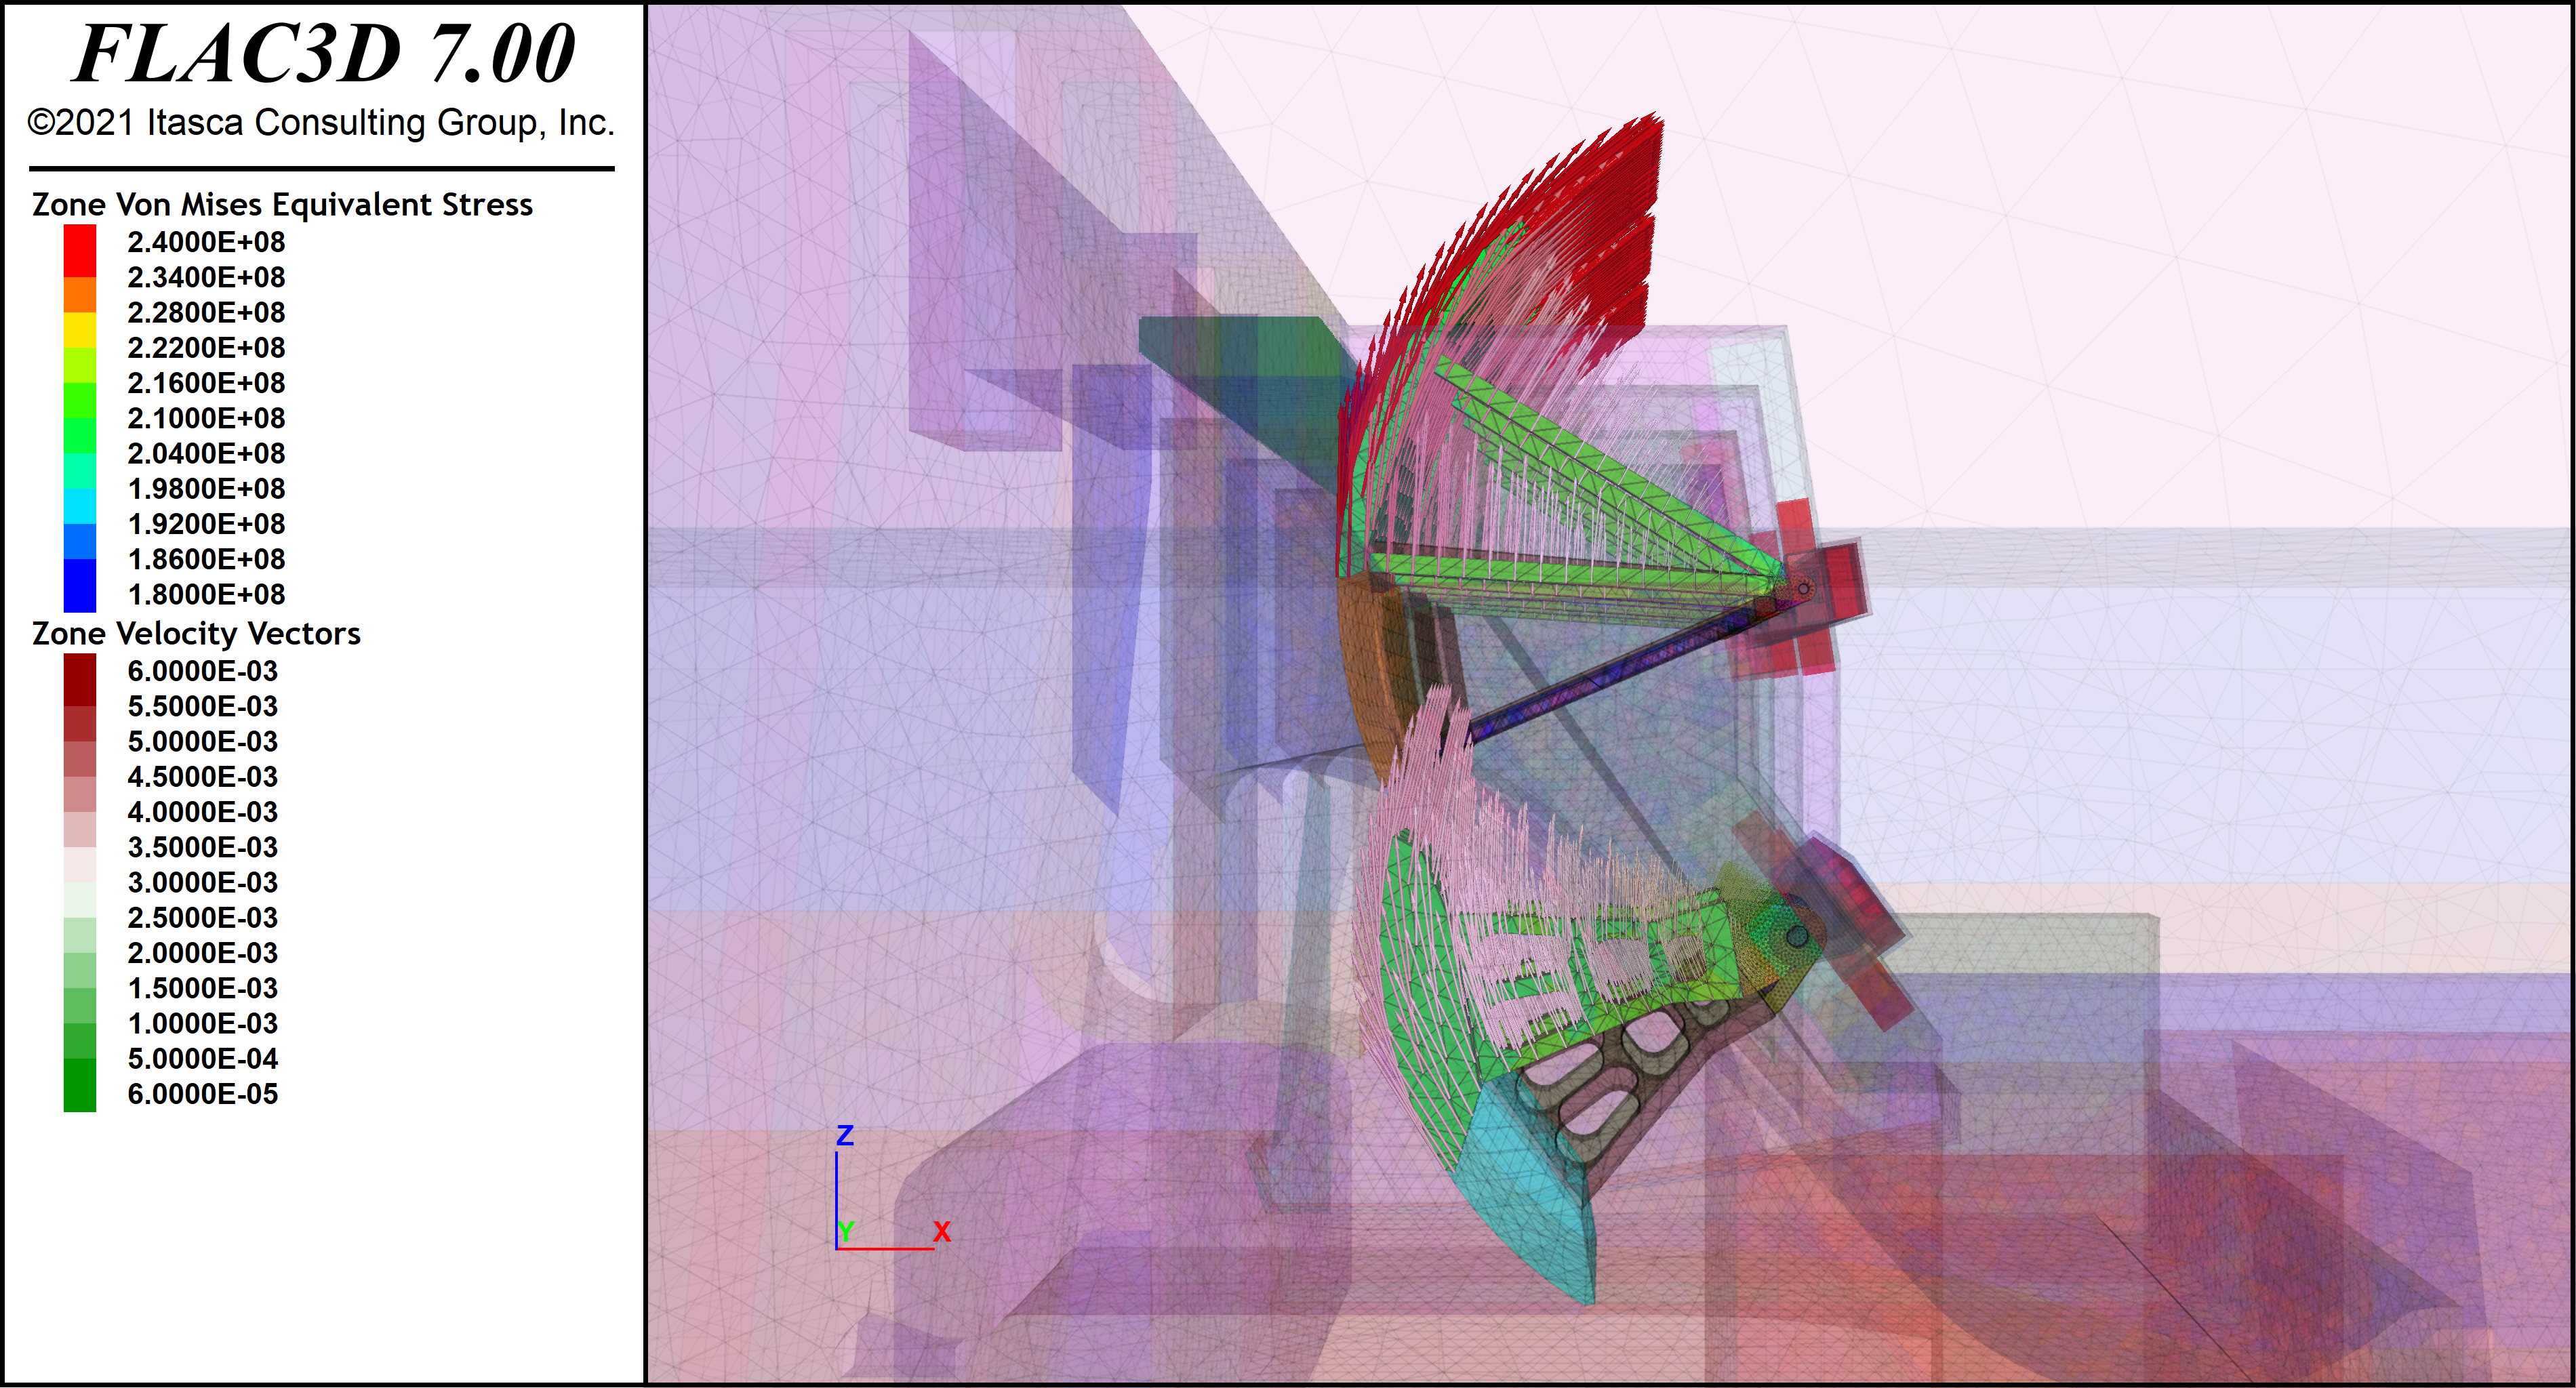
Francesco Raggi | ELC Electroconsult, Italy
Gravity Dam Radial Gates Opening Perspective: the displacements of the gates have been calculated in large-strain mode imposing a constant rotational velocity and modelling the trunnion-gate structure interaction with interfaces. In the figure, the initial and the final position are depicted. The gates are also loaded by water pressure. A FISH function was implemented to correctly apply water pressure and rotation taking into account the update of the geometry of the model.
And Now for Something Totally Different
Otto Scheffler | University of Stellenbosch, South Africa
The use of DEM to model packaging arrangements during apple transport is illustrated. The presented model can predict the location and extent of bruising on an individual apple. Balls together with the Linear Parallel Bond Model are used to simulate the presence of trays. Apples (modelled using clumps and rendered with their associated .stl surfaces) are generated in an industry standard arrangement. Hereafter, balls are generated using the spherical coordinate system, around the apples, and the Cartesian coordinate system for the tray horizontals and subsequently bonded. Trays are rendered using the parallel bond contact state and represented as cylinders.
Honorable Mentions
Craig Stemp | Douglas Partners, Australia
Subsidence assessments are required for new buildings in the Newcastle CBD area in Australia. The CBD is underlain by old coal mine workings, subsequently the coal board requires assessments to be made on the adequacy of grouting measures prior to construction. The assessments conservatively assume a 'pillar run' in which the surrounding pillars are softened to yield state. The plot shows the vertical stress in the grout/existing pillar mass with an isosurface of 20mm subsidence. This is not your typical subsidence plot and has been labelled as 'reverse subsidence' as the movement with in the isosurface is 20mm or less. The overburden where the isosurface is located is the anisotropic elastic model and colors of density have been changed to visualize potential changes in the strata above the workings.
Bora Pulatsu | Carleton University, Canada
Collapse mechanism for an ancient stone masonry tower subjected to seismic forces.
Dirk Zapf | Leibniz University of Hannover, Germany
Gas storage cavern in rock salt, surrounded by a potash layer. This figure show the beauty of geological structures. The gas storage cavern had to be placed carefully in the potash layer pocket to ensure the stability and gas tightness.
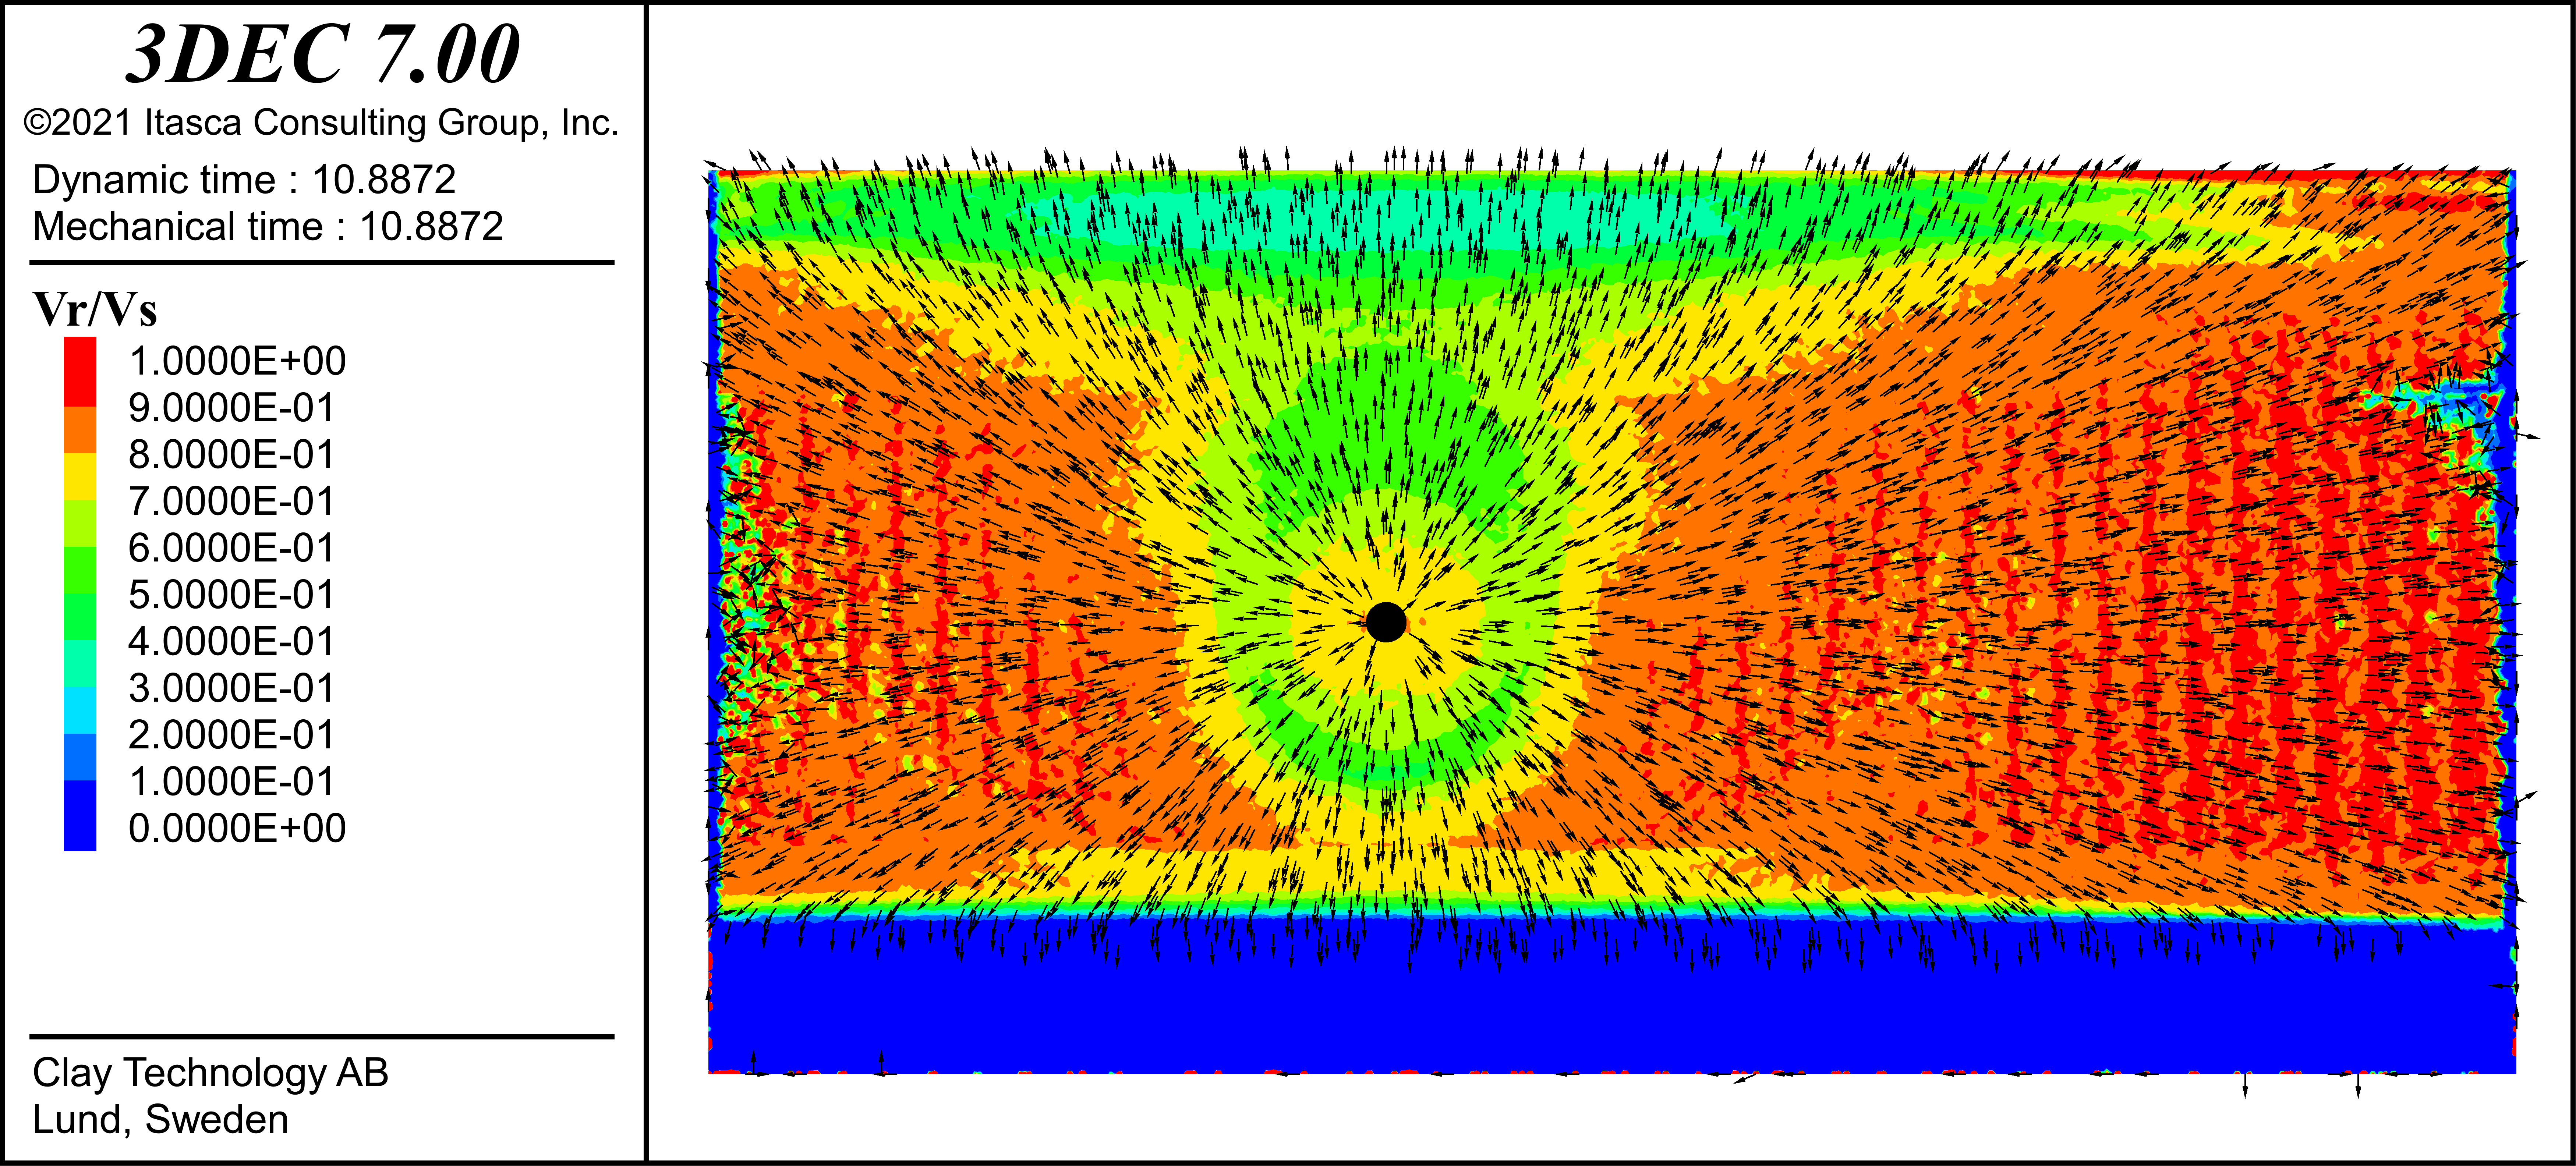
Billy Fälth | Clay Technology AB, Sweden
The contours indicate rupture velocity normalized to the rock mass shear wave velocity (Vr/Vs) in a 3DEC simulation of a Mw 7.0 earthquake on a vertical strike-slip fault. The arrows indicate the rupture front propagation direction, and the black dot indicates the hypocenter. The fault plane is 40 km in the along-strike direction and 20 km in the down-dip direction. The average discretization edge length is about 90 m in the volume adjacent to the fault plane and the model contains approximately 140 million finite difference zones.
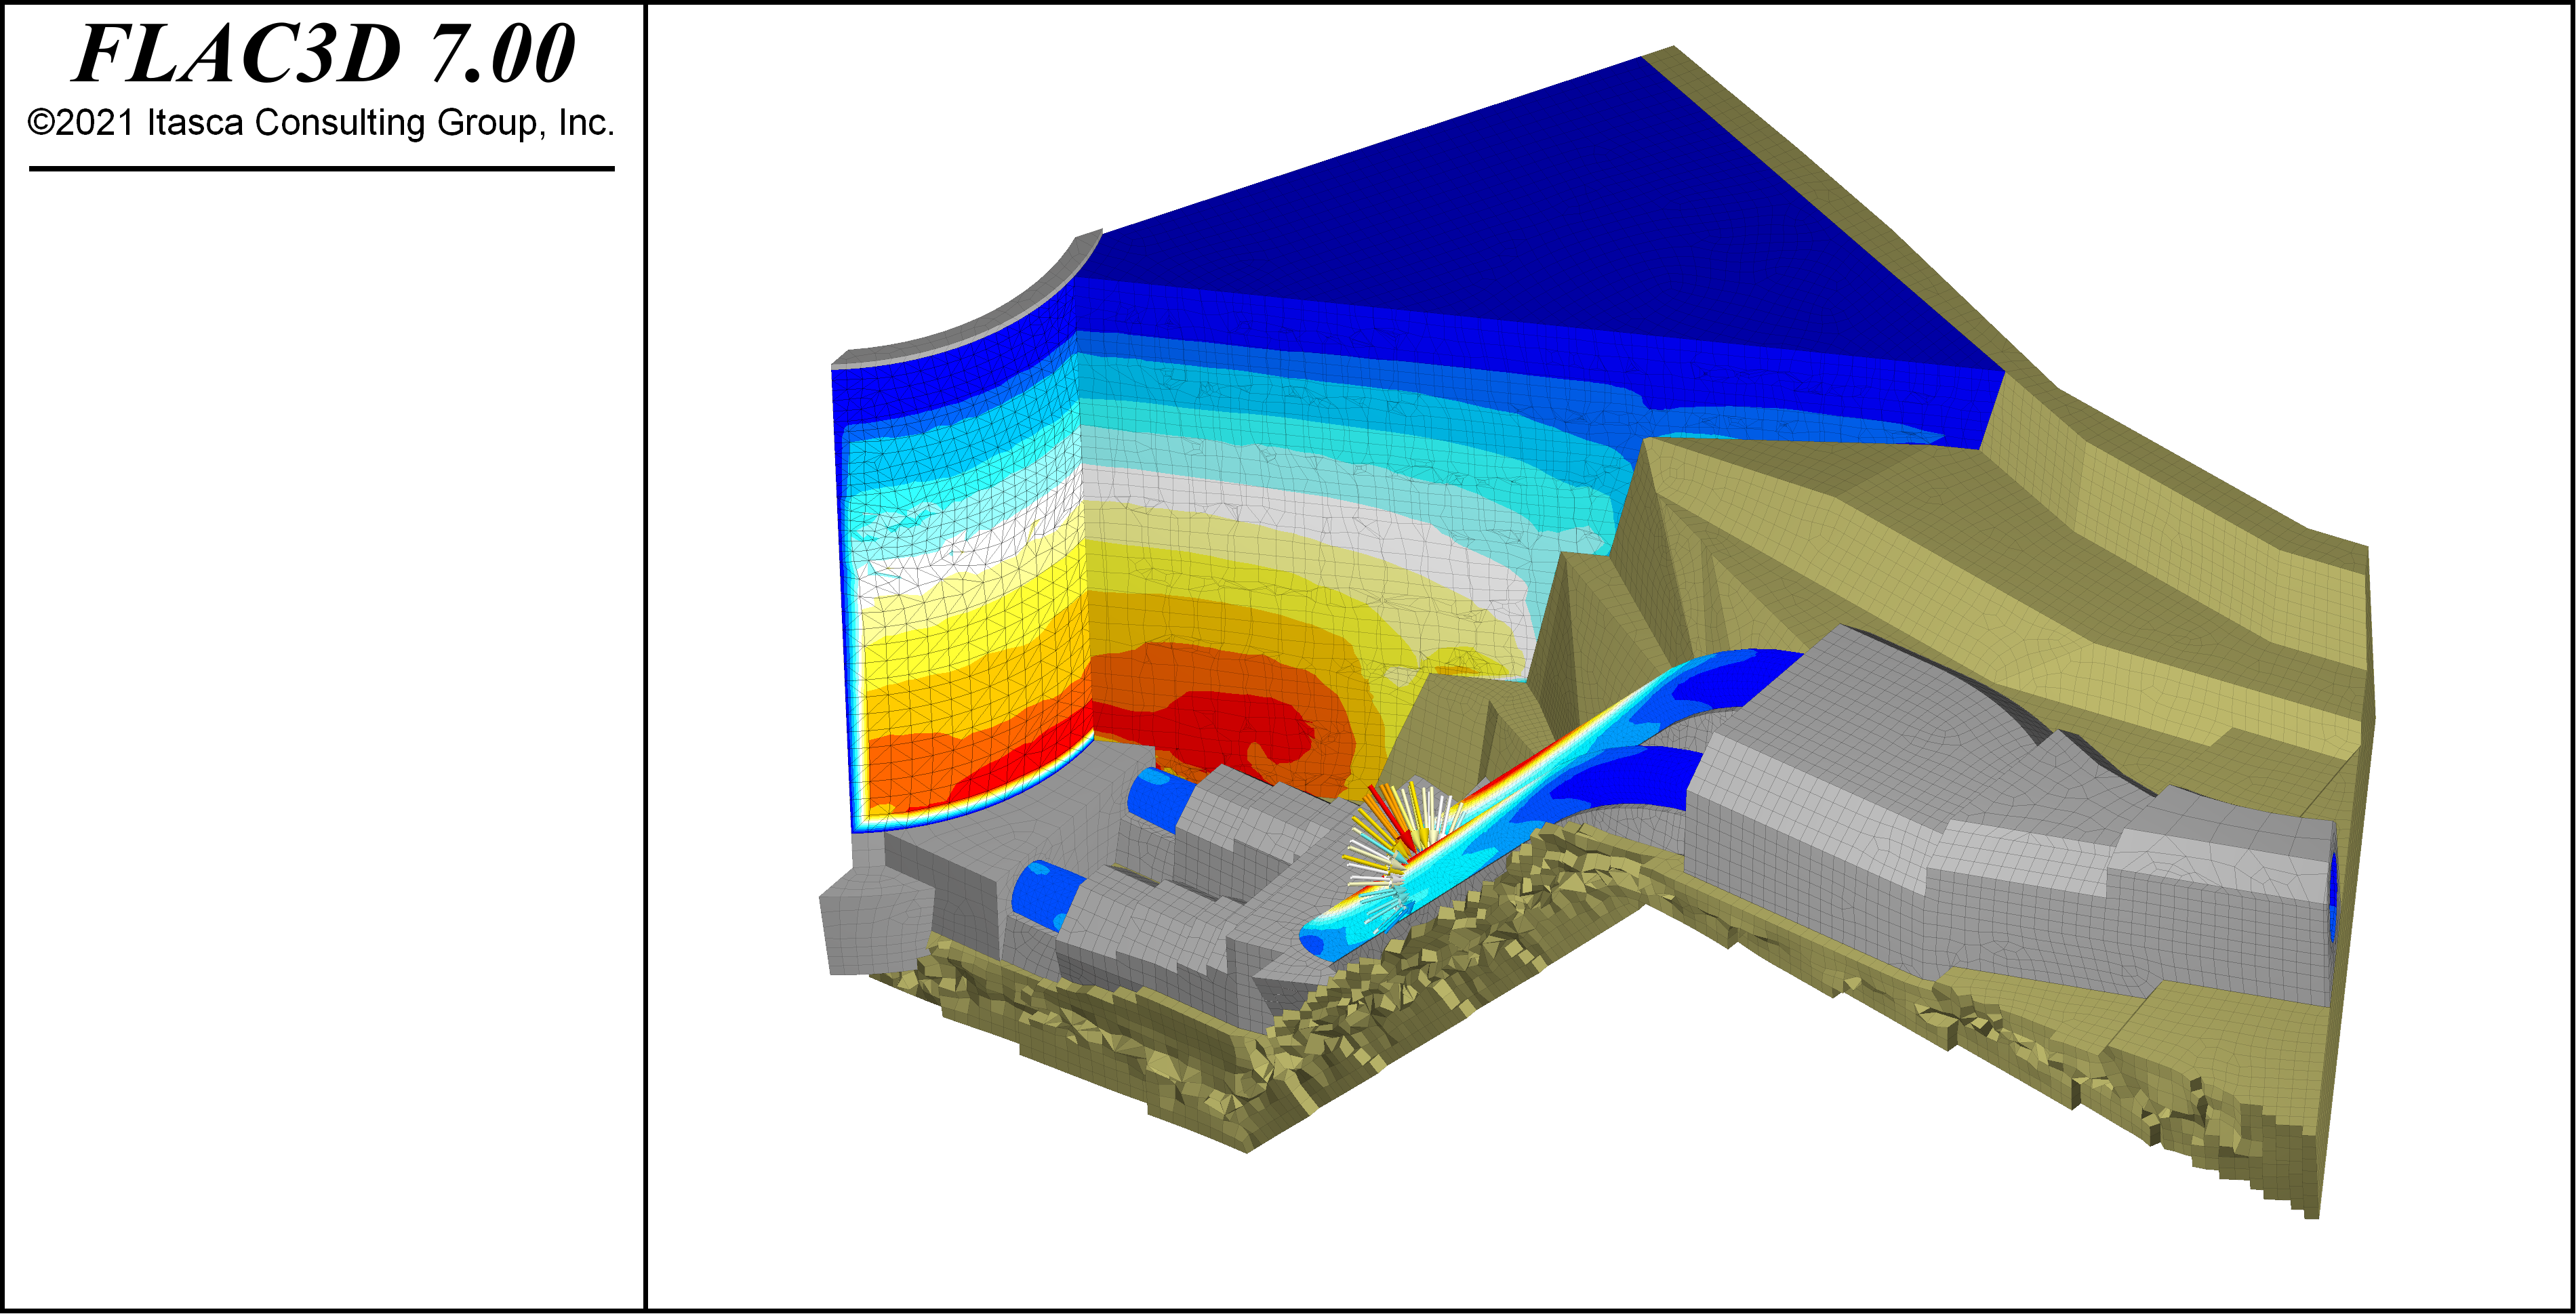
Bruno Conte | Artelia Group, France
This FLAC3D model was developed to estimate the loads applied to the buried penstock of a Pumped-storage hydroelectricity project. In the model are represented the penstock (liner element), part of the powerplant, the bedrock, the concrete structures and the rockfill surrounding it (volumetric). The results being plotted are mainly normal or vertical stresses. The vectors were created to allow a better understanding of the loads applied to a cross section.