
Microseismic Quality Control Using Synthetic Seismograms
In this case study, a downhole microseismic array was used to monitor a Woodford Shale hydraulic fracture treatment. The initial processing resulted in events being located significantly above the horizontal treatment well and laterally offset from the initiation point, along with a lack of microseismicity at the initiation points. Interpretation of the microseismic image was therefore compromised and undermined the value of information to confidently interpret the fracture geometry. A quality control evaluation was performed to assess the location patterns, including the use of synthetic microseismic signals computed from different origin points.
Methodology
The method employed in this case study involves several steps to help identify the presence, cause, and solution for the apparent processing artifact. The workflow is outlined in the following steps:
- Assess the velocity model calibration – Perform an initial assessment of the velocity model, including QC of the sonic logs, method for calibrating the model, and calibration shot relocations.
- Evaluate waveform complexity with synthetics – Select/relocate a subset of calibration events and compare recorded signals for stages that may appear problematic, as well as those which do not to identify potential for systematic mispicks.
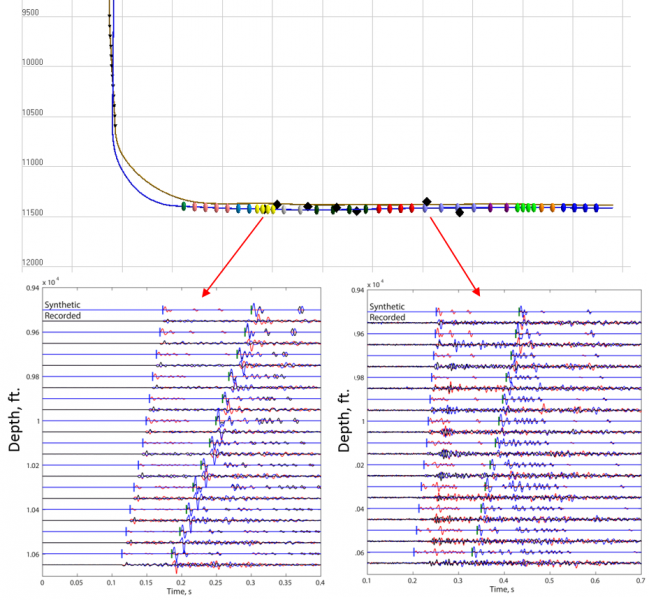
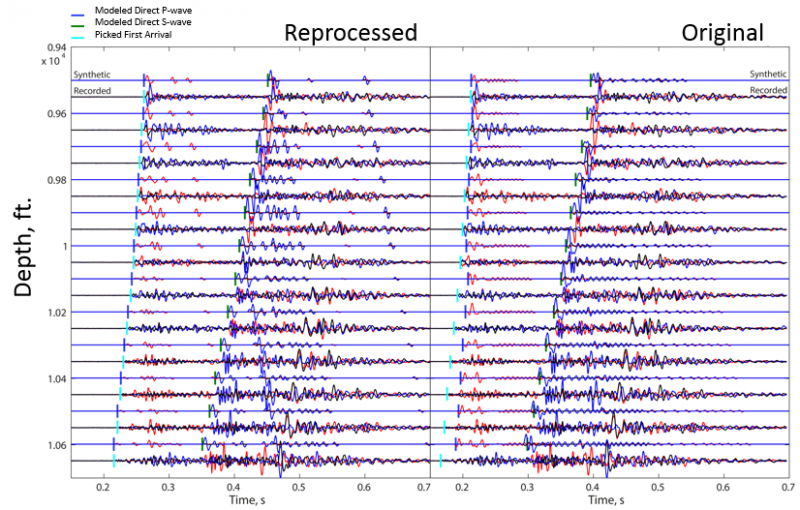
3. Compare synthetics of original processing and reprocessing to the observations – Select events from both the original data and reprocessed calibration subset and generate synthetic waveforms for each. Compare the results to the recorded data to determine the adequacy of the fit throughout the waveform. If the fit is appropriate for both waveforms, the data may be deemed adequate in the original processing. If notable deviations from the recorded signal are observed in the original processing, the data may require a reprocess. Repeat the calibration process using the synthetics as a guide if necessary to improve the fit.
4. Reprocess entire dataset – Continue processing the dataset using the knowledge obtained in previous steps.
5. Validate reprocess result with synthetic comparisons – If any artifacts are still suspected, QC of the reprocessed result can be continued with the questionable events using synthetic signals similarly to step 3.
A cross correlation of the waveform kurtosis can be used to obtain a quantitative measure of the fit of the synthetic waveforms to the recorded data. The comparison is done for both event locations and both synthetics, with the cross correlation performed 4 times to assess the match. The figure below shows the stacked correlation for all sensors in the bold black line, as well as the individual sensor correlations (dashed colored lines).
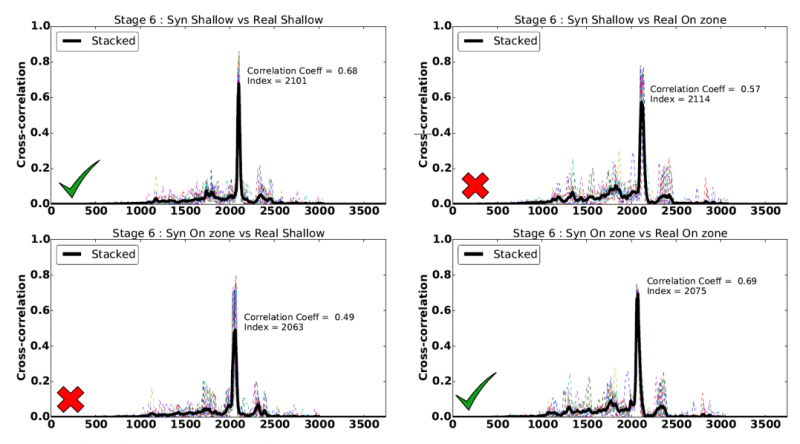
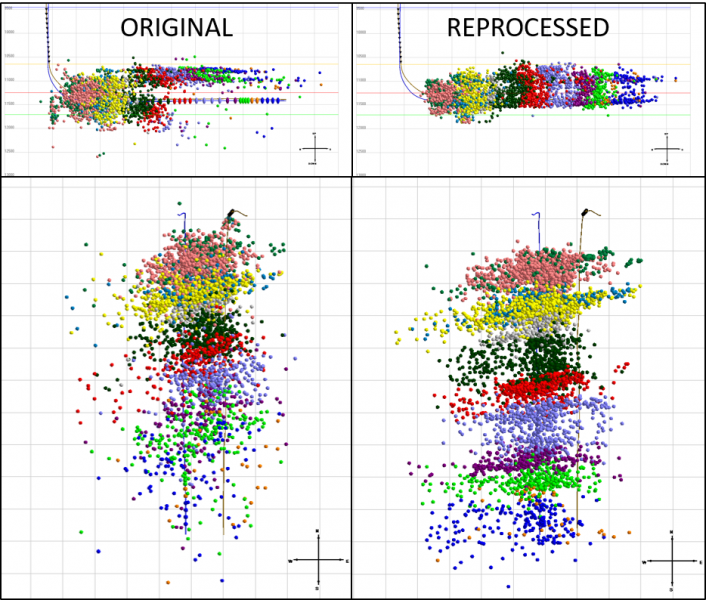
The stages with the suspected processing artifacts were found to suffer from significant signal complexity. The microseismicity was relocated using the synthetic signals to guide phase interpretation, which resulted in locating microseismicity much closer to the fracture initiation points. Discrepancies between the original and reprocessed results were assessed by correlating synthetic waveforms from the corresponding locations with the recorded signals. The reprocessed results were shown to better correlate with the recorded waveforms than the original, disperse locations.
The presence of waveform complexity in the recorded microseismic often creates a significant challenge for accurate event processing and location. The generation of synthetic seismograms may also add value to pre-survey modeling by predicting the presence of such complexities to assist in selection of sensor placement before acquisition. Finally, industry-sanctioned synthetic microseismic data sets could be a useful resource to benchmark different processing strategies.